September 2016 Market Summary Report for Central Texas, including Austin area, Travis, Williamson, and Hays Counties.
![]()
![]()
![]()
![]()
![]()
Leander Homes for Sale & Sold Report – Septermber 2016
Greetings! Summer is over and schools have started already. As the holiday season gets closer, some take advantage of cooler fall days and start working on the projects that have been put off until now. If a move is part of your plan in the future, now is the time to spruce up the house and get it prepared.
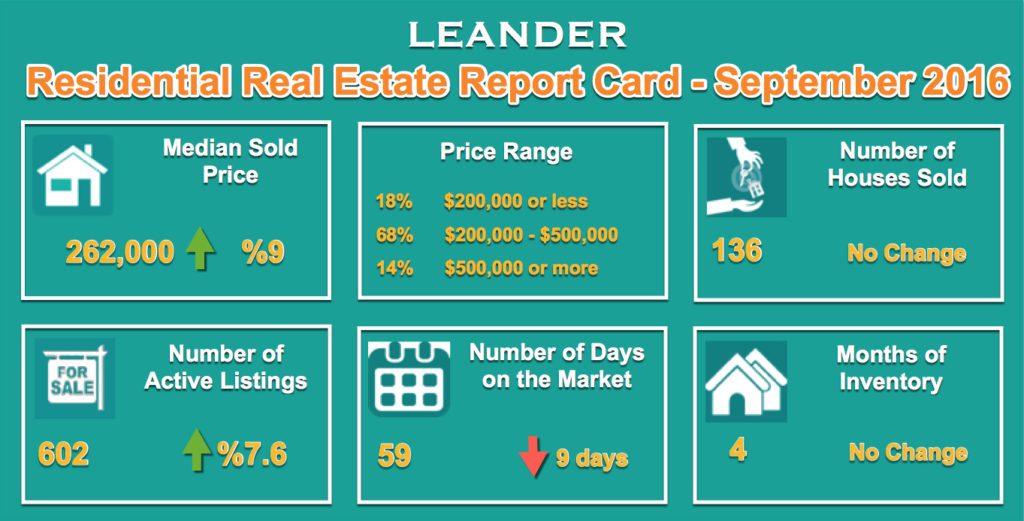
Fall and winter are slower seasons for selling a house, but as evidenced by the report card below, the Leander housing market has not slowed at all. Although the number of Leander Homes sold in September 2016 doesn’t show any increase relative to last year, the median price of the homes sold in Leander keeps climbing. Inventory of houses for sale shows slight increase relative to last year. The number of ‘days in the market’ is around 8 weeks which is not long at all. Think of it this way, if you are thinking about selling, and put your house on the market today, it should sell before the Christmas! All this indicates that the demand is still strong and available inventory is being absorbed at a quick rate.
The Leander single-family home sales during September 2016 is summarized below. All comparisons are relative to September 2015.

You can explore details of all the Leander home sales in September below.
City of Leander is on a long term growth pattern, the 2015 Leander residential Development Plan has identified 33 different neighborhood development areas, and these plans call for over 14,000 houses to be built or the next few years. The size and location of these areas varies, the largest being Travisso development of over 3400 houses, and the smallest one is a tract of 7 houses in the Parker Tract.
All this activity has affected your home’s value!
If you plan to move, you need to know the value of your home right now. You can find this out in two easy ways:
I hope you find this helpful. Referral is a big part of my business and as always I appreciate your consideration in referring any friends, family, or colleagues my way. Thank you for supporting me and my business endeavors. Please don’t hesitate to ask me questions about real estate, your desired neighborhoods, or your house value!
Best wishes,
|
|||||||||||||
|
|
||||||||||||
 |
|||||||||||||
Cypress Creek & Neighboring Communities Homes for Sale & Sold Report – September 2016
Greetings! Summer is over and schools have started already. As the holiday season gets closer, some take advantage of cooler fall days and start working on the projects that have been put off until now. If a move is part of your plan in the future, now is the time to spruce up the house and get it prepared.
Fall and winter are slower seasons for selling a house, but as evidenced by the report card below, the Cedar Park housing market has not slowed at all. Although the number of Cedar Park Homes sold in September 2016 showed a double digit decline relative to last year (this is the third consecutive month); the median price of the Cedar Park homes sold is climbing, and inventory of houses for sale is at the same level as last year. The number of ‘days in the market’ is around 4 weeks which is not long at all. Think of it this way, if you are thinking about selling, if put your house on the market today, it should sell before the Thanksgiving holiday! All this indicates that the demand is still strong and available inventory is being absorbed at a quick rate.
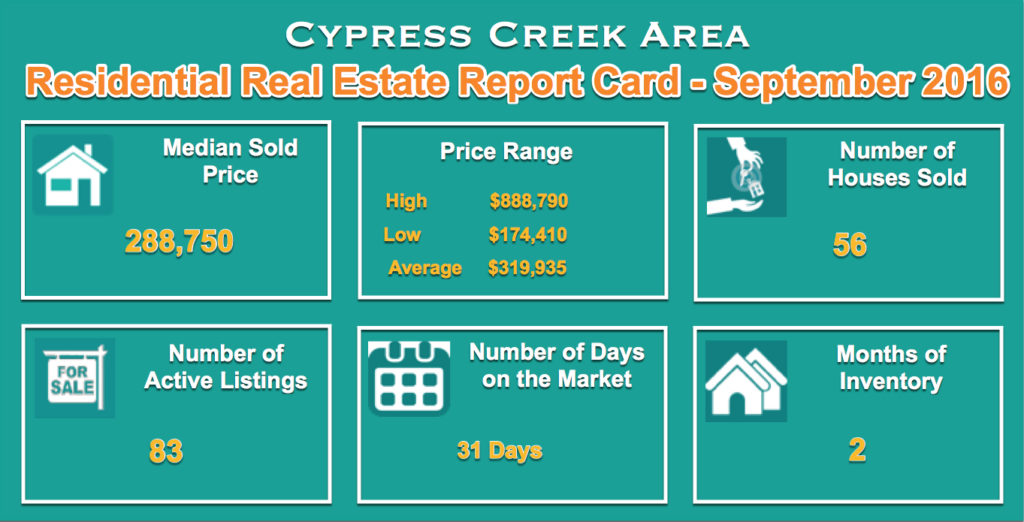
More specific to the Cypress Creek and neighboring communities, single-family home sales activities can be summarized as:

You can explore details of all the 56 Cypress Creek are home sales in September below.
The Cedar Park single-family home sales during September 2016 is summarized below. All comparisons are relative to September 2015.

City of Cedar Park is on a long term growth pattern, the 2014 Cedar Park planning document has identified 6 different areas, totaling 1130 acres around the city as future residential development areas. The size and location of these areas varies from 60 to 350 acres and covers different areas of town. This is
All this activity has affected your home’s value!
If you plan to move, you need to know the value of your home right now. You can find this out in two easy ways:
![]()
I hope you find this helpful. Referral is a big part of my business and as always I appreciate your consideration in referring any friends, family, or colleagues my way. Thank you for supporting me and my business endeavors. Please don’t hesitate to ask me questions about real estate, your desired neighborhoods, or your house value!
Best wishes,
|
|||||||||||||
|
|
||||||||||||
 |
|||||||||||||
Cedar Park Homes for Sale & Sold Report – September 2016
Greetings! Summer is over and schools have started already. As the holiday season gets closer, some take advantage of cooler fall days and start working on the projects that have been put off until now. If a move is part of your plan in the future, now is the time to spruce up the house and get it prepared.
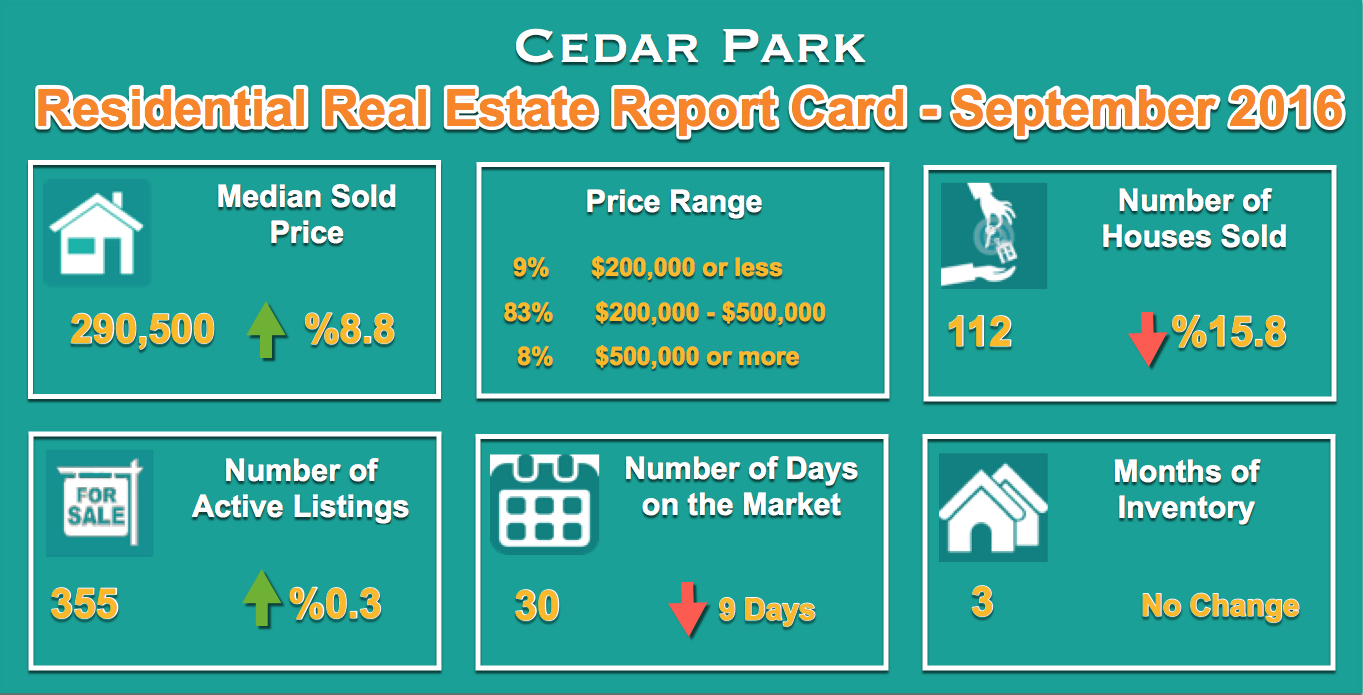
Fall and winter are slower seasons for selling a house, but as evidenced by the report card below, the Cedar Park housing market has not slowed at all. Although the number of Cedar Park Homes sold in September 2016 showed a double digit decline relative to last year (this is the third consecutive month); the median price of the Cedar Park homes sold is climbing, and inventory of houses for sale is at the same level as last year. The number of ‘days in the market’ is around 4 weeks which is not long at all. Think of it this way, if you are thinking about selling, if put your house on the market today, it should sell before the Thanksgiving holiday! All this indicates that the demand is still strong and available inventory is being absorbed at a quick rate.
Here is a report card for single-family home sales in Cedar Park area in September 2016. All comparisons are relative to September 2015.

You can explore details of all the 112 Cedar Park home sales in September below.
City of Cedar Park is on a long term growth pattern, the 2014 Cedar Park planning document has identified 6 different areas, totaling 1130 acres around the city as future residential development areas. The size and location of these areas varies from 60 to 350 acres and covers different areas of town.
All this activity has affected your home’s value!
If you plan to move, you need to know the value of your home right now. You can find this out in two easy ways:
![]()
I hope you find this helpful. Referral is a big part of my business and as always I appreciate your consideration in referring any friends, family, or colleagues my way. Thank you for supporting me and my business endeavors. Please don’t hesitate to ask me questions about real estate, your desired neighborhoods, or your house value!
Best wishes,
|
|||||||||||||
|
|
||||||||||||
 |
|||||||||||||